Review


anti p irf7 antibody  (Cell Signaling Technology Inc)


Bioz Verified Symbol Cell Signaling Technology Inc is a verified supplier

Bioz Manufacturer Symbol Cell Signaling Technology Inc manufactures this product  

  • Logo
  • About
  • News
  • Press Release
  • Team
  • Advisors
  • Partners
  • Contact
  • Bioz Stars
  • Bioz vStars
  • 96

    Structured Review

    Cell Signaling Technology Inc anti p irf7 antibody
    Anti P Irf7 Antibody, supplied by Cell Signaling Technology Inc, used in various techniques. Bioz Stars score: 96/100, based on 1169 PubMed citations. ZERO BIAS - scores, article reviews, protocol conditions and more
    https://www.bioz.com/product/anti+p+irf7+antibody/pm41910148-174-22-24?v=Cell+Signaling+Technology+Inc
    Average 96 stars, based on 1169 article reviews
    anti p irf7 antibody - by Bioz Stars, 2026-08
    96/100 stars

    Images


    Similar Products

    94
    Bioss p irf7
    P Irf7, supplied by Bioss, used in various techniques. Bioz Stars score: 94/100, based on 1 PubMed citations. ZERO BIAS - scores, article reviews, protocol conditions and more
    https://www.bioz.com/product/anti+p+irf7+antibody/pm40769268-72-33-34?v=Bioss
    Average 94 stars, based on 1 article reviews
    p irf7 - by Bioz Stars, 2026-08
    94/100 stars
      Buy from Supplier

    96
    Cell Signaling Technology Inc anti p irf7 antibody
    Anti P Irf7 Antibody, supplied by Cell Signaling Technology Inc, used in various techniques. Bioz Stars score: 96/100, based on 1 PubMed citations. ZERO BIAS - scores, article reviews, protocol conditions and more
    https://www.bioz.com/product/anti+p+irf7+antibody/pm41910148-174-22-24?v=Cell+Signaling+Technology+Inc
    Average 96 stars, based on 1 article reviews
    anti p irf7 antibody - by Bioz Stars, 2026-08
    96/100 stars
      Buy from Supplier

    94
    Cell Signaling Technology Inc rabbit anti p irf7 antibody 24129s
    Rabbit Anti P Irf7 Antibody 24129s, supplied by Cell Signaling Technology Inc, used in various techniques. Bioz Stars score: 94/100, based on 1 PubMed citations. ZERO BIAS - scores, article reviews, protocol conditions and more
    https://www.bioz.com/product/anti+p+irf7+antibody/pm41774756-231-0-7?v=Cell+Signaling+Technology+Inc
    Average 94 stars, based on 1 article reviews
    rabbit anti p irf7 antibody 24129s - by Bioz Stars, 2026-08
    94/100 stars
      Buy from Supplier

    94
    Bioss rabbit anti p irf7
    Forward and reverse sequences of each gene analyzed by real-time polymerase chain reaction
    Rabbit Anti P Irf7, supplied by Bioss, used in various techniques. Bioz Stars score: 94/100, based on 1 PubMed citations. ZERO BIAS - scores, article reviews, protocol conditions and more
    https://www.bioz.com/product/anti+p+irf7+antibody/pmc11759022-129-39-42?v=Bioss
    Average 94 stars, based on 1 article reviews
    rabbit anti p irf7 - by Bioz Stars, 2026-08
    94/100 stars
      Buy from Supplier

    96
    Cell Signaling Technology Inc rabbit anti p irf7 polyclonal antibody
    Forward and reverse sequences of each gene analyzed by real-time polymerase chain reaction
    Rabbit Anti P Irf7 Polyclonal Antibody, supplied by Cell Signaling Technology Inc, used in various techniques. Bioz Stars score: 96/100, based on 1 PubMed citations. ZERO BIAS - scores, article reviews, protocol conditions and more
    https://www.bioz.com/product/anti+p+irf7+antibody/pm39874992-91-28-48?v=Cell+Signaling+Technology+Inc
    Average 96 stars, based on 1 article reviews
    rabbit anti p irf7 polyclonal antibody - by Bioz Stars, 2026-08
    96/100 stars
      Buy from Supplier

    96
    Cell Signaling Technology Inc anti p irf7
    Forward and reverse sequences of each gene analyzed by real-time polymerase chain reaction
    Anti P Irf7, supplied by Cell Signaling Technology Inc, used in various techniques. Bioz Stars score: 96/100, based on 1 PubMed citations. ZERO BIAS - scores, article reviews, protocol conditions and more
    https://www.bioz.com/product/anti+p+irf7+antibody/pmc11182629-469-17-19?v=Cell+Signaling+Technology+Inc
    Average 96 stars, based on 1 article reviews
    anti p irf7 - by Bioz Stars, 2026-08
    96/100 stars
      Buy from Supplier

    96
    Cell Signaling Technology Inc p irf7 ser477
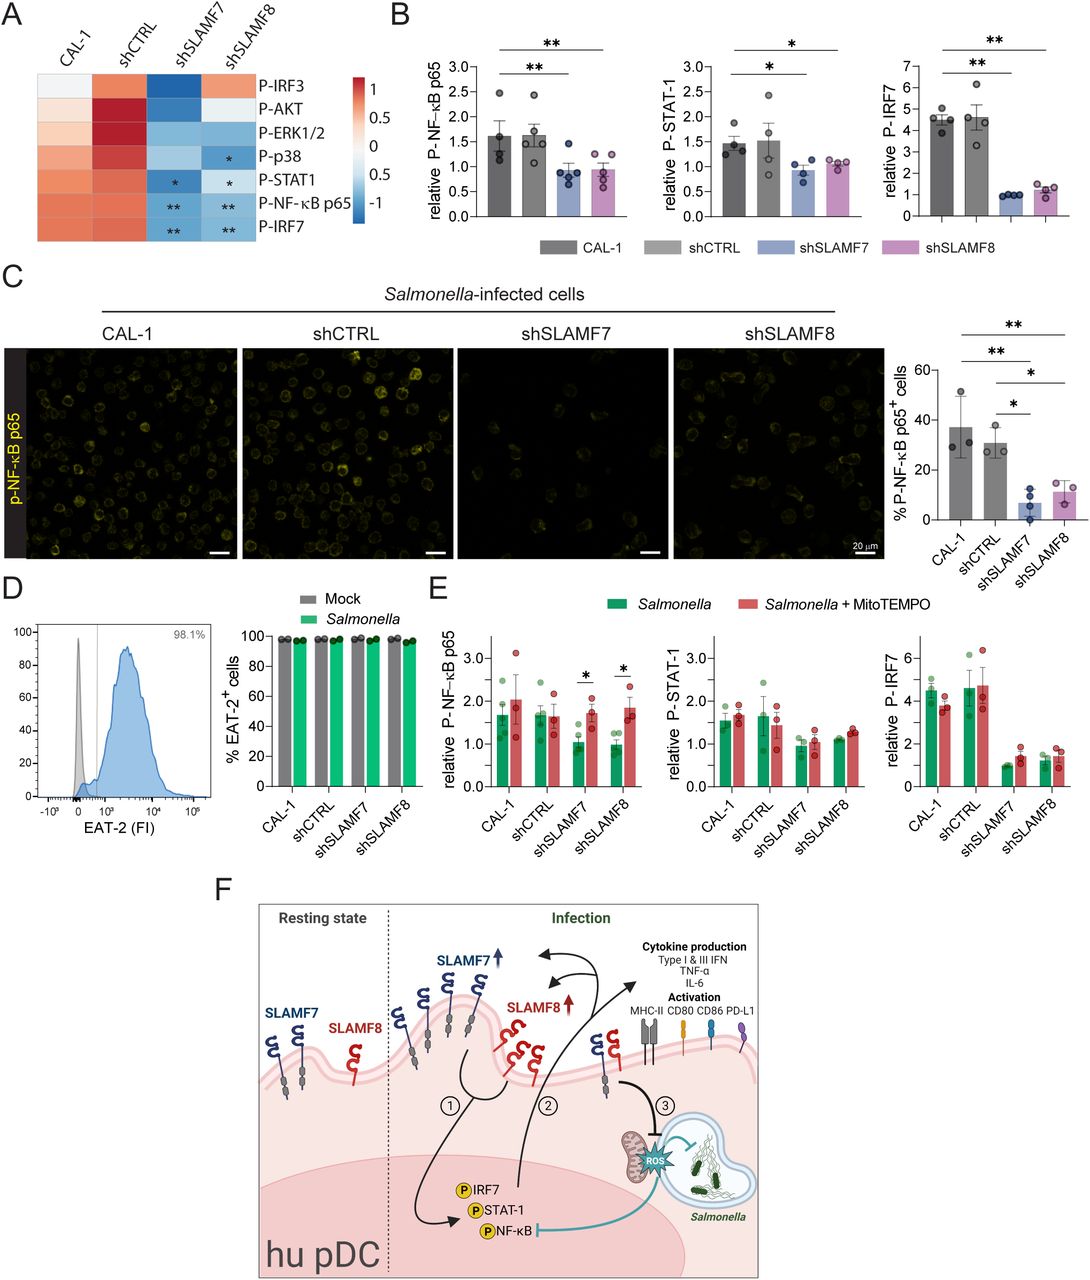
    A-D . CAL-1 and stably transduced (ShCTRL, shSLAMF7, ShSLAMF8) CAL-1 cells were infected with DsRed WT S. Typhimurium (M.O.I. of 25) for 3 h. Then, cells were fixed, permeabilized, and stained for Phospho-flow cytometry or confocal microscopy. A. Heatmap showing MFI levels for P-IRF3, P-NF- κB p65, <t>P-IRF7,</t> P-ERK-1/2, P-p38, P-STAT1 and P-AKT of Salmonella -infected cells at 3 h p.i. relative to Mock condition. Multiple comparison Kruskal-Wallis test, followed by post-hoc Dunn’s test. n=4. B. Column graphs showing relative MFI of phosphorylated proteins (left, P-NF-κB p65; middle, P-STAT-1; right, P-IRF7) in infected cells. Mean ± SD. n=5. C. Left, representative confocal images of P-NF-κB p65 in CAL-1 and stably transduced CAL-1 cells infected with Salmonella . Scale bars: 20 μm. Right, quantification of P-NF-κB p65 + cells. n=3. One-way ANOVA followed by Dunnett’s multiple comparison test. D. Left, representative flow cytometry histogram of EAT-2 adaptor expression (fluorescence intensity (FI) in CAL-1 cells with positivity indicated by a vertical grey bar. Right, percentages of EAT- 2 + CAL-1 and stably transduced cells infected (Green) or not (Grey) with S. Typhimurium. n=3. E. CAL- 1 and stably transduced CAL-1 cells were infected with DsRed WT Salmonella Typhimurium (M.O.I. of 25) for 1 h. After washes and resuspension in gentamicin-containing medium, cells were treated with MitoTEMPO (100µM) for 2 h. Phospho-flow cytometry was performed to analyze the phosphorylation levels of selected proteins. Column graphs show relative MFI of P-NF-κB p65 (left), P-STAT-1 (middle) and P-IRF7 (right). Mean ± SD. n=4. Two-way ANOVA followed by Sidak’s multiple comparison test. Only statistical differences are shown. *, p < 0.05; **, p < 0.01; *** p < 0.001; **** p < 0.0001. no p value, non-significant. F. Proposed model for SLAMF7 and SLAMF8 function in human pDC during intracellular bacterial infection. At the resting state, few SLAMF8 is expressed on the surface of human pDC in contrast to higher SLAMF7 levels. Infection with an intracellular bacterium, like Salmonella , engages SLAMF7 and SLAMF8 receptors, and elicits the phosphorylation and activation of IRF7, STAT- 1 and NF-κB in a SLAMF7/8-dependent manner . This induces the expression of SLAMF7, SLAMF8, pDC activation markers, as well as cytokine secretion (TNF-α, IL-6 and type I and III IFN) . Elevated levels of SLAMF7 or SLAMF8 restrain mitochondrial ROS production, and subsequently favor NF-κB activation as well as Salmonella persistence . This illustration was created using Biorender.
    P Irf7 Ser477, supplied by Cell Signaling Technology Inc, used in various techniques. Bioz Stars score: 96/100, based on 1 PubMed citations. ZERO BIAS - scores, article reviews, protocol conditions and more
    https://www.bioz.com/product/anti+p+irf7+antibody/bio_rxiv__2024__04__25__591064-170-44-68?v=Cell+Signaling+Technology+Inc
    Average 96 stars, based on 1 article reviews
    p irf7 ser477 - by Bioz Stars, 2026-08
    96/100 stars
      Buy from Supplier

    93
    Cell Signaling Technology Inc p irf7
    A-D . CAL-1 and stably transduced (ShCTRL, shSLAMF7, ShSLAMF8) CAL-1 cells were infected with DsRed WT S. Typhimurium (M.O.I. of 25) for 3 h. Then, cells were fixed, permeabilized, and stained for Phospho-flow cytometry or confocal microscopy. A. Heatmap showing MFI levels for P-IRF3, P-NF- κB p65, <t>P-IRF7,</t> P-ERK-1/2, P-p38, P-STAT1 and P-AKT of Salmonella -infected cells at 3 h p.i. relative to Mock condition. Multiple comparison Kruskal-Wallis test, followed by post-hoc Dunn’s test. n=4. B. Column graphs showing relative MFI of phosphorylated proteins (left, P-NF-κB p65; middle, P-STAT-1; right, P-IRF7) in infected cells. Mean ± SD. n=5. C. Left, representative confocal images of P-NF-κB p65 in CAL-1 and stably transduced CAL-1 cells infected with Salmonella . Scale bars: 20 μm. Right, quantification of P-NF-κB p65 + cells. n=3. One-way ANOVA followed by Dunnett’s multiple comparison test. D. Left, representative flow cytometry histogram of EAT-2 adaptor expression (fluorescence intensity (FI) in CAL-1 cells with positivity indicated by a vertical grey bar. Right, percentages of EAT- 2 + CAL-1 and stably transduced cells infected (Green) or not (Grey) with S. Typhimurium. n=3. E. CAL- 1 and stably transduced CAL-1 cells were infected with DsRed WT Salmonella Typhimurium (M.O.I. of 25) for 1 h. After washes and resuspension in gentamicin-containing medium, cells were treated with MitoTEMPO (100µM) for 2 h. Phospho-flow cytometry was performed to analyze the phosphorylation levels of selected proteins. Column graphs show relative MFI of P-NF-κB p65 (left), P-STAT-1 (middle) and P-IRF7 (right). Mean ± SD. n=4. Two-way ANOVA followed by Sidak’s multiple comparison test. Only statistical differences are shown. *, p < 0.05; **, p < 0.01; *** p < 0.001; **** p < 0.0001. no p value, non-significant. F. Proposed model for SLAMF7 and SLAMF8 function in human pDC during intracellular bacterial infection. At the resting state, few SLAMF8 is expressed on the surface of human pDC in contrast to higher SLAMF7 levels. Infection with an intracellular bacterium, like Salmonella , engages SLAMF7 and SLAMF8 receptors, and elicits the phosphorylation and activation of IRF7, STAT- 1 and NF-κB in a SLAMF7/8-dependent manner . This induces the expression of SLAMF7, SLAMF8, pDC activation markers, as well as cytokine secretion (TNF-α, IL-6 and type I and III IFN) . Elevated levels of SLAMF7 or SLAMF8 restrain mitochondrial ROS production, and subsequently favor NF-κB activation as well as Salmonella persistence . This illustration was created using Biorender.
    P Irf7, supplied by Cell Signaling Technology Inc, used in various techniques. Bioz Stars score: 93/100, based on 1 PubMed citations. ZERO BIAS - scores, article reviews, protocol conditions and more
    https://www.bioz.com/product/anti+p+irf7+antibody/pm38455571-115-37-41?v=Cell+Signaling+Technology+Inc
    Average 93 stars, based on 1 article reviews
    p irf7 - by Bioz Stars, 2026-08
    93/100 stars
      Buy from Supplier

    Image Search Results


    Forward and reverse sequences of each gene analyzed by real-time polymerase chain reaction

    Journal: Neural Regeneration Research

    Article Title: The cGAS-STING-interferon regulatory factor 7 pathway regulates neuroinflammation in Parkinson’s disease

    doi: 10.4103/NRR.NRR-D-23-01684

    Figure Lengend Snippet: Forward and reverse sequences of each gene analyzed by real-time polymerase chain reaction

    Article Snippet: They were then blocked using 5% goat serum and 0.3% Triton X-100 for 1.5 hours at room temperature (approximately 30°C), followed by incubation overnight at 4°C with the following primary antibodies: rabbit anti-IRF7 (1:200, Boster, Cat# BM4484, RRID: AB_3076601), rabbit anti-p-IRF7 (1:200, Bioss, Cat# bs-3196R, RRID: AB_10857567), and rabbit anti-CD68 (Boster, Cat# BA3638, RRID: AB_2813855).

    Techniques: Sequencing

    Validation of the expression levels of the hub genes in an MPTP-induced mouse model of PD. (A) RT-PCR analysis of the mRNA expression levels of the five identified hub genes ( IRF7 , TAC1 , FGF13 , IFNA2 , and SOCS3 ) in striatal tissue from the MPTP-induced PD group and the saline group ( n = 6 per group). (B) Receiver operating characteristic analysis showcasing the diagnostic potential of IRF7, TAC1, and FGF13 in predicting PD. (C) Expression levels of TH, a marker gene indicative of dopaminergic neurons, in the PD and normal groups. (D) Correlation plot illustrating the negative relationship between the expression levels of the central genes IRF7 and TH ( r < –0.3 indicates a negative correlation). (E) Western blot showing the protein expression levels of TH, IRF7, and its phosphorylated form, p-IRF7, in the striatum of MPTP-treated mice ( n = 6 per group). (F) IHC staining for IRF7 in the striatum and quantitative analysis of the MOD ( n = 3 per group). IRF7 expression (brown staining) was significantly upregulated in the MPTP group. Scale bars: 100 μm (10× magnification) and 20 μm (40× magnification). Data are presented as mean ± SEM. * P < 0.05, ** P < 0.01, *** P < 0.001 (unpaired t -test). AUC: Area under the curve; FGF13: fibroblast growth factor 13; GAPDH: glyceraldehyde-3-phosphate dehydrogenase; IFNA2: interferon α2; IHC: immunohistochemical; IRF7: interferon regulatory factor 7; MOD: mean optical density; MPTP: 1-methyl-4-phenyl-1,2,3,6-tetrahydropyridin; ns: not significant; PD: Parkinson’s disease; RT-PCR: real-time polymerase chain reaction; SOCS3: suppressor of cytokine signaling 3; TAC1: tachykinin 1; TH: tyrosine hydroxylase.

    Journal: Neural Regeneration Research

    Article Title: The cGAS-STING-interferon regulatory factor 7 pathway regulates neuroinflammation in Parkinson’s disease

    doi: 10.4103/NRR.NRR-D-23-01684

    Figure Lengend Snippet: Validation of the expression levels of the hub genes in an MPTP-induced mouse model of PD. (A) RT-PCR analysis of the mRNA expression levels of the five identified hub genes ( IRF7 , TAC1 , FGF13 , IFNA2 , and SOCS3 ) in striatal tissue from the MPTP-induced PD group and the saline group ( n = 6 per group). (B) Receiver operating characteristic analysis showcasing the diagnostic potential of IRF7, TAC1, and FGF13 in predicting PD. (C) Expression levels of TH, a marker gene indicative of dopaminergic neurons, in the PD and normal groups. (D) Correlation plot illustrating the negative relationship between the expression levels of the central genes IRF7 and TH ( r < –0.3 indicates a negative correlation). (E) Western blot showing the protein expression levels of TH, IRF7, and its phosphorylated form, p-IRF7, in the striatum of MPTP-treated mice ( n = 6 per group). (F) IHC staining for IRF7 in the striatum and quantitative analysis of the MOD ( n = 3 per group). IRF7 expression (brown staining) was significantly upregulated in the MPTP group. Scale bars: 100 μm (10× magnification) and 20 μm (40× magnification). Data are presented as mean ± SEM. * P < 0.05, ** P < 0.01, *** P < 0.001 (unpaired t -test). AUC: Area under the curve; FGF13: fibroblast growth factor 13; GAPDH: glyceraldehyde-3-phosphate dehydrogenase; IFNA2: interferon α2; IHC: immunohistochemical; IRF7: interferon regulatory factor 7; MOD: mean optical density; MPTP: 1-methyl-4-phenyl-1,2,3,6-tetrahydropyridin; ns: not significant; PD: Parkinson’s disease; RT-PCR: real-time polymerase chain reaction; SOCS3: suppressor of cytokine signaling 3; TAC1: tachykinin 1; TH: tyrosine hydroxylase.

    Article Snippet: They were then blocked using 5% goat serum and 0.3% Triton X-100 for 1.5 hours at room temperature (approximately 30°C), followed by incubation overnight at 4°C with the following primary antibodies: rabbit anti-IRF7 (1:200, Boster, Cat# BM4484, RRID: AB_3076601), rabbit anti-p-IRF7 (1:200, Bioss, Cat# bs-3196R, RRID: AB_10857567), and rabbit anti-CD68 (Boster, Cat# BA3638, RRID: AB_2813855).

    Techniques: Expressing, Reverse Transcription Polymerase Chain Reaction, Saline, Diagnostic Assay, Marker, Western Blot, Immunohistochemistry, Staining, Immunohistochemical staining, Real-time Polymerase Chain Reaction

    Analysis of IRF7 expression, immune cell infiltration, and mitochondrial function in a mouse model of PD and in BV2 cells. (A) Box plots depicting the differential distribution of 10 immune cell types in the PD and normal groups. (B) Spearman correlation analysis between cell types with differential infiltration levels and IRF7 expression in PD. A correlation coefficient greater than 0.3 indicates a positive correlation, while a coefficient less than 0.3 suggests no significant correlation. (C) Immunofluorescence staining of striatal tissue from an MPTP-induced PD mouse model showing CD68 (red: Cy3), IRF7 (green: FITC), and DAPI (blue). Quantitative analysis of IRF7 and CD68 co-localization in 10 representative brain sections. The number of CD68 and IRF7 double-positive cells per field of vision was higher in the MPTP group than in the saline group. Scale bars: 20 μm. (D) Cellular immunofluorescence staining showing IRF7 (red: Cy3) and DAPI (blue). The relative mean fluorescence intensity of the control group (red: IRF7) was significantly lower than that of the MPP + group (red: IRF7). Co-localization of IRF7 and cell nuclei. Scale bars: 20 μm. (E) Western blot analysis of the expression levels of mitochondrial function–associated proteins in MPP + -treated BV2 cells ( n = 6 independent experiments). (F) RT-PCR analysis showing the expression of mitochondrial damage–associated genes (PGC1A and TFAM) in BV2 cells treated with MPP + . Data are presented as mean ± SEM ( n = 6 independent experiments). * P < 0.05, ** P < 0.01, *** P < 0.001 (unpaired t -test). GAPDH: Glyceraldehyde-3-phosphate dehydrogenase; IF: immunofluorescence; IRF7: interferon regulatory factor 7; MPP + : 1-methyl-4-phenylpyridinium; MPTP: 1-methyl-4-phenyl-1,2,3,6-tetrahydropyridin; PD: Parkinson’s disease; PGC1A: peroxisome proliferator-activated receptor-gamma coactivator-1alpha; RT-PCR: real-time polymerase chain reaction; TFAM: mitochondrial transcription factor A.

    Journal: Neural Regeneration Research

    Article Title: The cGAS-STING-interferon regulatory factor 7 pathway regulates neuroinflammation in Parkinson’s disease

    doi: 10.4103/NRR.NRR-D-23-01684

    Figure Lengend Snippet: Analysis of IRF7 expression, immune cell infiltration, and mitochondrial function in a mouse model of PD and in BV2 cells. (A) Box plots depicting the differential distribution of 10 immune cell types in the PD and normal groups. (B) Spearman correlation analysis between cell types with differential infiltration levels and IRF7 expression in PD. A correlation coefficient greater than 0.3 indicates a positive correlation, while a coefficient less than 0.3 suggests no significant correlation. (C) Immunofluorescence staining of striatal tissue from an MPTP-induced PD mouse model showing CD68 (red: Cy3), IRF7 (green: FITC), and DAPI (blue). Quantitative analysis of IRF7 and CD68 co-localization in 10 representative brain sections. The number of CD68 and IRF7 double-positive cells per field of vision was higher in the MPTP group than in the saline group. Scale bars: 20 μm. (D) Cellular immunofluorescence staining showing IRF7 (red: Cy3) and DAPI (blue). The relative mean fluorescence intensity of the control group (red: IRF7) was significantly lower than that of the MPP + group (red: IRF7). Co-localization of IRF7 and cell nuclei. Scale bars: 20 μm. (E) Western blot analysis of the expression levels of mitochondrial function–associated proteins in MPP + -treated BV2 cells ( n = 6 independent experiments). (F) RT-PCR analysis showing the expression of mitochondrial damage–associated genes (PGC1A and TFAM) in BV2 cells treated with MPP + . Data are presented as mean ± SEM ( n = 6 independent experiments). * P < 0.05, ** P < 0.01, *** P < 0.001 (unpaired t -test). GAPDH: Glyceraldehyde-3-phosphate dehydrogenase; IF: immunofluorescence; IRF7: interferon regulatory factor 7; MPP + : 1-methyl-4-phenylpyridinium; MPTP: 1-methyl-4-phenyl-1,2,3,6-tetrahydropyridin; PD: Parkinson’s disease; PGC1A: peroxisome proliferator-activated receptor-gamma coactivator-1alpha; RT-PCR: real-time polymerase chain reaction; TFAM: mitochondrial transcription factor A.

    Article Snippet: They were then blocked using 5% goat serum and 0.3% Triton X-100 for 1.5 hours at room temperature (approximately 30°C), followed by incubation overnight at 4°C with the following primary antibodies: rabbit anti-IRF7 (1:200, Boster, Cat# BM4484, RRID: AB_3076601), rabbit anti-p-IRF7 (1:200, Bioss, Cat# bs-3196R, RRID: AB_10857567), and rabbit anti-CD68 (Boster, Cat# BA3638, RRID: AB_2813855).

    Techniques: Expressing, Immunofluorescence, Staining, Saline, Fluorescence, Control, Western Blot, Reverse Transcription Polymerase Chain Reaction, Real-time Polymerase Chain Reaction

    The cGAS-STING pathway plays a pivotal role in regulating IRF7 activation and nuclear translocation. (A) Western blot analysis of the expression of key molecules (cGAS, p-STING, and TBK1) in the cGAS-STING-TBK1 pathway within the striatum of MPTP-treated mice ( n = 6 per group). (B, C) BV2 cells were pre-treated with either RU.521 (2 µM) or H151 (5 µM) for 12 hours before being exposed to MPP + for an additional 24 hours, and western blotting was performed to determine the relative protein levels of p-IRF7 and IRF7 in these cells ( n = 6 independent experiments). (D) Fluorescence staining for nuclei (blue: DAPI) and p-IRF7 (red: Cy3). p-IRF7 localization to the nuclei was assessed by fluorescence microscopy. The percentage of p-IRF7 nuclear translocation in the MPP + -induced group was significantly higher than that in the control group, and pre-treatment with H151 significantly reduced the percentage of MPP + -induced p-IRF7 nuclear translocation. Arrows indicate nuclear translocation; scale bars: 20 μm. The percentage of cells with significant IRF7 nuclear translocation was calculated from multiple randomly selected fields of view (control samples: three fields of view, at least 200 cells; MPP + stimulated samples: three fields of view, at least 200 cells) ( n = 3 independent experiments). Data are presented as mean ± SEM. * P < 0.05, ** P < 0.01, *** P < 0.001 (unpaired t -test [A] or one-way analysis of variance followed by Tukey’s post hoc test [B–D]). cGAS: Cyclic guanosine monophosphate adenosine monophosphate synthase; GAPDH: glyceraldehyde-3-phosphate dehydrogenase; H-151: a STING inhibitor; IRF7: interferon regulatory factor 7; MPP + : 1-methyl-4-phenylpyridinium; MPTP: 1-methyl-4-phenyl-1,2,3,6-tetrahydropyridin; ns: not significant; p-IRF7: phospho-IRF7; p-STING: phospho-STING; RU.521: a selective cGAS inhibitor; STING: stimulator of interferon genes; TBK1: TANK-binding kinase 1.

    Journal: Neural Regeneration Research

    Article Title: The cGAS-STING-interferon regulatory factor 7 pathway regulates neuroinflammation in Parkinson’s disease

    doi: 10.4103/NRR.NRR-D-23-01684

    Figure Lengend Snippet: The cGAS-STING pathway plays a pivotal role in regulating IRF7 activation and nuclear translocation. (A) Western blot analysis of the expression of key molecules (cGAS, p-STING, and TBK1) in the cGAS-STING-TBK1 pathway within the striatum of MPTP-treated mice ( n = 6 per group). (B, C) BV2 cells were pre-treated with either RU.521 (2 µM) or H151 (5 µM) for 12 hours before being exposed to MPP + for an additional 24 hours, and western blotting was performed to determine the relative protein levels of p-IRF7 and IRF7 in these cells ( n = 6 independent experiments). (D) Fluorescence staining for nuclei (blue: DAPI) and p-IRF7 (red: Cy3). p-IRF7 localization to the nuclei was assessed by fluorescence microscopy. The percentage of p-IRF7 nuclear translocation in the MPP + -induced group was significantly higher than that in the control group, and pre-treatment with H151 significantly reduced the percentage of MPP + -induced p-IRF7 nuclear translocation. Arrows indicate nuclear translocation; scale bars: 20 μm. The percentage of cells with significant IRF7 nuclear translocation was calculated from multiple randomly selected fields of view (control samples: three fields of view, at least 200 cells; MPP + stimulated samples: three fields of view, at least 200 cells) ( n = 3 independent experiments). Data are presented as mean ± SEM. * P < 0.05, ** P < 0.01, *** P < 0.001 (unpaired t -test [A] or one-way analysis of variance followed by Tukey’s post hoc test [B–D]). cGAS: Cyclic guanosine monophosphate adenosine monophosphate synthase; GAPDH: glyceraldehyde-3-phosphate dehydrogenase; H-151: a STING inhibitor; IRF7: interferon regulatory factor 7; MPP + : 1-methyl-4-phenylpyridinium; MPTP: 1-methyl-4-phenyl-1,2,3,6-tetrahydropyridin; ns: not significant; p-IRF7: phospho-IRF7; p-STING: phospho-STING; RU.521: a selective cGAS inhibitor; STING: stimulator of interferon genes; TBK1: TANK-binding kinase 1.

    Article Snippet: They were then blocked using 5% goat serum and 0.3% Triton X-100 for 1.5 hours at room temperature (approximately 30°C), followed by incubation overnight at 4°C with the following primary antibodies: rabbit anti-IRF7 (1:200, Boster, Cat# BM4484, RRID: AB_3076601), rabbit anti-p-IRF7 (1:200, Bioss, Cat# bs-3196R, RRID: AB_10857567), and rabbit anti-CD68 (Boster, Cat# BA3638, RRID: AB_2813855).

    Techniques: Activation Assay, Translocation Assay, Western Blot, Expressing, Fluorescence, Staining, Microscopy, Control, Binding Assay

    Impact of IRF7 knockdown and H151 pre-treatment on microglial inflammatory responses and phenotypic markers in BV2 cells exposed to MPP + . (A) IRF7 mRNA expression in cells subjected to si-IRF7 knockdown was determined by RT-PCR, which showed an approximate 80% reduction ( n = 3 independent experiments). (B) BV2 cells were pre-treated with si-IRF7 for 60 hours and then exposed to MPP + for an additional 24 hours. Western blot analysis was used to detect the relative protein levels of IRF7 and IFN-β in BV2 cells stimulated with MPP + after si-IRF7 pre-treatment ( n = 5 independent experiments). (C) Western blotting was used to detect the relative protein levels of iNOS and TNF-α in BV2 cells stimulated with MPP + after si-IRF7 pre-treatment ( n = 5 independent experiments). (D) BV2 cells were pre-treated with H151 (5 µM) for 12 hours and then exposed to MPP + for another 24 hours. RT-PCR was used to detect markers of the M1 ( CD16 , CD32 , and CD86 ) and M2 ( ARG1 , YM1 ) phenotypes ( n = 6 independent experiments). Data are presented as mean ± SEM. * P < 0.05, ** P < 0.01, *** P < 0.001 (unpaired t -test [A] or one-way analysis of variance followed by Tukey’s post hoc test [B–D]). ARG1: Arginase 1; GAPDH: glyceraldehyde-3-phosphate dehydrogenase; H-151: a STING inhibitor; IFN-β: interferon-beta; IRF7: interferon regulatory factor 7; iNOS: inducible nitric oxide synthase; MPP+: 1-methyl-4-phenylpyridinium; ns: not significant; RT-PCR: real-time polymerase chain reaction; si-IRF7: small interfering RNA targeting IRF7; TNF-α: tumor necrosis factor-alpha.

    Journal: Neural Regeneration Research

    Article Title: The cGAS-STING-interferon regulatory factor 7 pathway regulates neuroinflammation in Parkinson’s disease

    doi: 10.4103/NRR.NRR-D-23-01684

    Figure Lengend Snippet: Impact of IRF7 knockdown and H151 pre-treatment on microglial inflammatory responses and phenotypic markers in BV2 cells exposed to MPP + . (A) IRF7 mRNA expression in cells subjected to si-IRF7 knockdown was determined by RT-PCR, which showed an approximate 80% reduction ( n = 3 independent experiments). (B) BV2 cells were pre-treated with si-IRF7 for 60 hours and then exposed to MPP + for an additional 24 hours. Western blot analysis was used to detect the relative protein levels of IRF7 and IFN-β in BV2 cells stimulated with MPP + after si-IRF7 pre-treatment ( n = 5 independent experiments). (C) Western blotting was used to detect the relative protein levels of iNOS and TNF-α in BV2 cells stimulated with MPP + after si-IRF7 pre-treatment ( n = 5 independent experiments). (D) BV2 cells were pre-treated with H151 (5 µM) for 12 hours and then exposed to MPP + for another 24 hours. RT-PCR was used to detect markers of the M1 ( CD16 , CD32 , and CD86 ) and M2 ( ARG1 , YM1 ) phenotypes ( n = 6 independent experiments). Data are presented as mean ± SEM. * P < 0.05, ** P < 0.01, *** P < 0.001 (unpaired t -test [A] or one-way analysis of variance followed by Tukey’s post hoc test [B–D]). ARG1: Arginase 1; GAPDH: glyceraldehyde-3-phosphate dehydrogenase; H-151: a STING inhibitor; IFN-β: interferon-beta; IRF7: interferon regulatory factor 7; iNOS: inducible nitric oxide synthase; MPP+: 1-methyl-4-phenylpyridinium; ns: not significant; RT-PCR: real-time polymerase chain reaction; si-IRF7: small interfering RNA targeting IRF7; TNF-α: tumor necrosis factor-alpha.

    Article Snippet: They were then blocked using 5% goat serum and 0.3% Triton X-100 for 1.5 hours at room temperature (approximately 30°C), followed by incubation overnight at 4°C with the following primary antibodies: rabbit anti-IRF7 (1:200, Boster, Cat# BM4484, RRID: AB_3076601), rabbit anti-p-IRF7 (1:200, Bioss, Cat# bs-3196R, RRID: AB_10857567), and rabbit anti-CD68 (Boster, Cat# BA3638, RRID: AB_2813855).

    Techniques: Knockdown, Expressing, Reverse Transcription Polymerase Chain Reaction, Western Blot, Real-time Polymerase Chain Reaction, Small Interfering RNA

    A-D . CAL-1 and stably transduced (ShCTRL, shSLAMF7, ShSLAMF8) CAL-1 cells were infected with DsRed WT S. Typhimurium (M.O.I. of 25) for 3 h. Then, cells were fixed, permeabilized, and stained for Phospho-flow cytometry or confocal microscopy. A. Heatmap showing MFI levels for P-IRF3, P-NF- κB p65, P-IRF7, P-ERK-1/2, P-p38, P-STAT1 and P-AKT of Salmonella -infected cells at 3 h p.i. relative to Mock condition. Multiple comparison Kruskal-Wallis test, followed by post-hoc Dunn’s test. n=4. B. Column graphs showing relative MFI of phosphorylated proteins (left, P-NF-κB p65; middle, P-STAT-1; right, P-IRF7) in infected cells. Mean ± SD. n=5. C. Left, representative confocal images of P-NF-κB p65 in CAL-1 and stably transduced CAL-1 cells infected with Salmonella . Scale bars: 20 μm. Right, quantification of P-NF-κB p65 + cells. n=3. One-way ANOVA followed by Dunnett’s multiple comparison test. D. Left, representative flow cytometry histogram of EAT-2 adaptor expression (fluorescence intensity (FI) in CAL-1 cells with positivity indicated by a vertical grey bar. Right, percentages of EAT- 2 + CAL-1 and stably transduced cells infected (Green) or not (Grey) with S. Typhimurium. n=3. E. CAL- 1 and stably transduced CAL-1 cells were infected with DsRed WT Salmonella Typhimurium (M.O.I. of 25) for 1 h. After washes and resuspension in gentamicin-containing medium, cells were treated with MitoTEMPO (100µM) for 2 h. Phospho-flow cytometry was performed to analyze the phosphorylation levels of selected proteins. Column graphs show relative MFI of P-NF-κB p65 (left), P-STAT-1 (middle) and P-IRF7 (right). Mean ± SD. n=4. Two-way ANOVA followed by Sidak’s multiple comparison test. Only statistical differences are shown. *, p < 0.05; **, p < 0.01; *** p < 0.001; **** p < 0.0001. no p value, non-significant. F. Proposed model for SLAMF7 and SLAMF8 function in human pDC during intracellular bacterial infection. At the resting state, few SLAMF8 is expressed on the surface of human pDC in contrast to higher SLAMF7 levels. Infection with an intracellular bacterium, like Salmonella , engages SLAMF7 and SLAMF8 receptors, and elicits the phosphorylation and activation of IRF7, STAT- 1 and NF-κB in a SLAMF7/8-dependent manner . This induces the expression of SLAMF7, SLAMF8, pDC activation markers, as well as cytokine secretion (TNF-α, IL-6 and type I and III IFN) . Elevated levels of SLAMF7 or SLAMF8 restrain mitochondrial ROS production, and subsequently favor NF-κB activation as well as Salmonella persistence . This illustration was created using Biorender.

    Journal: bioRxiv

    Article Title: SLAMF7 and SLAMF8 receptors shape human plasmacytoid dendritic cell responses to intracellular bacteria

    doi: 10.1101/2024.04.25.591064

    Figure Lengend Snippet: A-D . CAL-1 and stably transduced (ShCTRL, shSLAMF7, ShSLAMF8) CAL-1 cells were infected with DsRed WT S. Typhimurium (M.O.I. of 25) for 3 h. Then, cells were fixed, permeabilized, and stained for Phospho-flow cytometry or confocal microscopy. A. Heatmap showing MFI levels for P-IRF3, P-NF- κB p65, P-IRF7, P-ERK-1/2, P-p38, P-STAT1 and P-AKT of Salmonella -infected cells at 3 h p.i. relative to Mock condition. Multiple comparison Kruskal-Wallis test, followed by post-hoc Dunn’s test. n=4. B. Column graphs showing relative MFI of phosphorylated proteins (left, P-NF-κB p65; middle, P-STAT-1; right, P-IRF7) in infected cells. Mean ± SD. n=5. C. Left, representative confocal images of P-NF-κB p65 in CAL-1 and stably transduced CAL-1 cells infected with Salmonella . Scale bars: 20 μm. Right, quantification of P-NF-κB p65 + cells. n=3. One-way ANOVA followed by Dunnett’s multiple comparison test. D. Left, representative flow cytometry histogram of EAT-2 adaptor expression (fluorescence intensity (FI) in CAL-1 cells with positivity indicated by a vertical grey bar. Right, percentages of EAT- 2 + CAL-1 and stably transduced cells infected (Green) or not (Grey) with S. Typhimurium. n=3. E. CAL- 1 and stably transduced CAL-1 cells were infected with DsRed WT Salmonella Typhimurium (M.O.I. of 25) for 1 h. After washes and resuspension in gentamicin-containing medium, cells were treated with MitoTEMPO (100µM) for 2 h. Phospho-flow cytometry was performed to analyze the phosphorylation levels of selected proteins. Column graphs show relative MFI of P-NF-κB p65 (left), P-STAT-1 (middle) and P-IRF7 (right). Mean ± SD. n=4. Two-way ANOVA followed by Sidak’s multiple comparison test. Only statistical differences are shown. *, p < 0.05; **, p < 0.01; *** p < 0.001; **** p < 0.0001. no p value, non-significant. F. Proposed model for SLAMF7 and SLAMF8 function in human pDC during intracellular bacterial infection. At the resting state, few SLAMF8 is expressed on the surface of human pDC in contrast to higher SLAMF7 levels. Infection with an intracellular bacterium, like Salmonella , engages SLAMF7 and SLAMF8 receptors, and elicits the phosphorylation and activation of IRF7, STAT- 1 and NF-κB in a SLAMF7/8-dependent manner . This induces the expression of SLAMF7, SLAMF8, pDC activation markers, as well as cytokine secretion (TNF-α, IL-6 and type I and III IFN) . Elevated levels of SLAMF7 or SLAMF8 restrain mitochondrial ROS production, and subsequently favor NF-κB activation as well as Salmonella persistence . This illustration was created using Biorender.

    Article Snippet: Phospho-flow staining was performed by fixing the cells with 3.2% PFA for 10 min at 20°C, followed by permeabilization with cold methanol for 15 min. After washing, intracellular staining with antibodies for phospho-proteins (Phospho-NF-κB p65 (Ser536) clone 93H1, #3033; P-Stat1 (Tyr701) clone D4A7, #7649; P-IRF7 (ser477) clone D7E1W, #42016; Phospho-IRF-3 (Ser396) #29047; P-AKT (thr308) #9275; Phospho-p38 MAPK (Thr180/Tyr182), #9211; Phospho-p44/42 MAPK (Erk1/2) (Thr202/Tyr204) clone D13.14.4E, #4370; all from Cell Signaling Technology) was done in 1xPBS 2%BSA.

    Techniques: Stable Transfection, Infection, Staining, Flow Cytometry, Confocal Microscopy, Comparison, Expressing, Fluorescence, Phospho-proteomics, Activation Assay